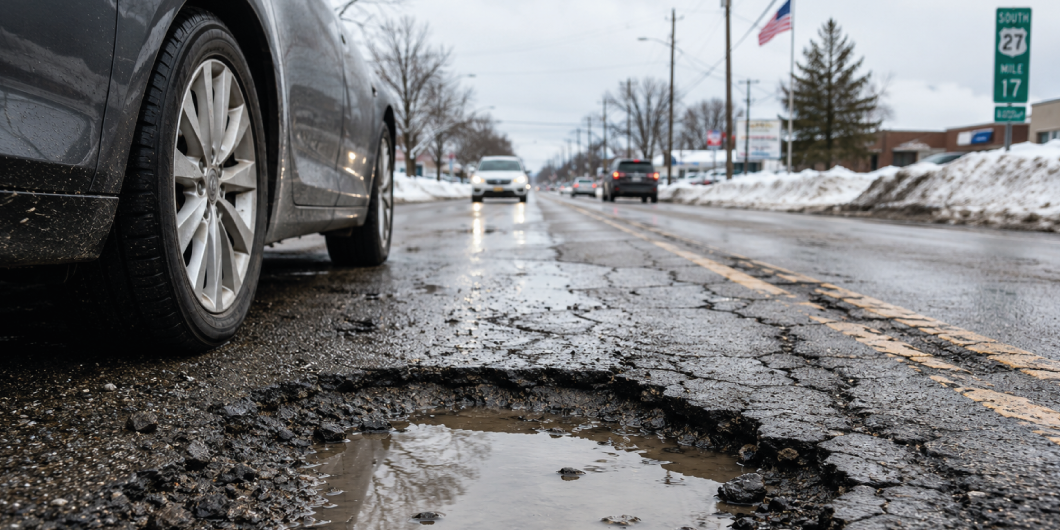
Every truck owner knows the feeling of hitting a pothole hard enough to rattle the cab. What many don't realize is how much rough roads cost them each year through extra repairs, faster tire wear, increased fuel consumption, and vehicle depreciation.
To uncover where drivers face the biggest financial burden, American Trucks analyzed state-level vehicle operating cost data alongside pavement quality metrics, climate stress factors, and national infrastructure assessments. We identified which states are putting the greatest strain on drivers' wallets, and why road conditions vary so dramatically across the country.
Key Takeaways
- America's roads scored just a D+ on ASCE's 2025 Infrastructure Report Card, reflecting years of deferred maintenance and underinvestment.
- The average American driver loses about $725 a year to rough roads through additional repairs, tire wear, depreciation, and fuel costs.
- Rhode Island leads with 32% of roads rated poor, followed by California (26%), Massachusetts (23%), and Hawaii (22%).
- Mississippi's drivers pay the most for rough roads, $1,062 a year in added repairs, tires, and wear.
Ranking the Annual Cost of Rough Roads, State by State
Poor pavement affects more than ride quality. Every bump, crack, and pothole can contribute to higher ownership costs that add up over time.
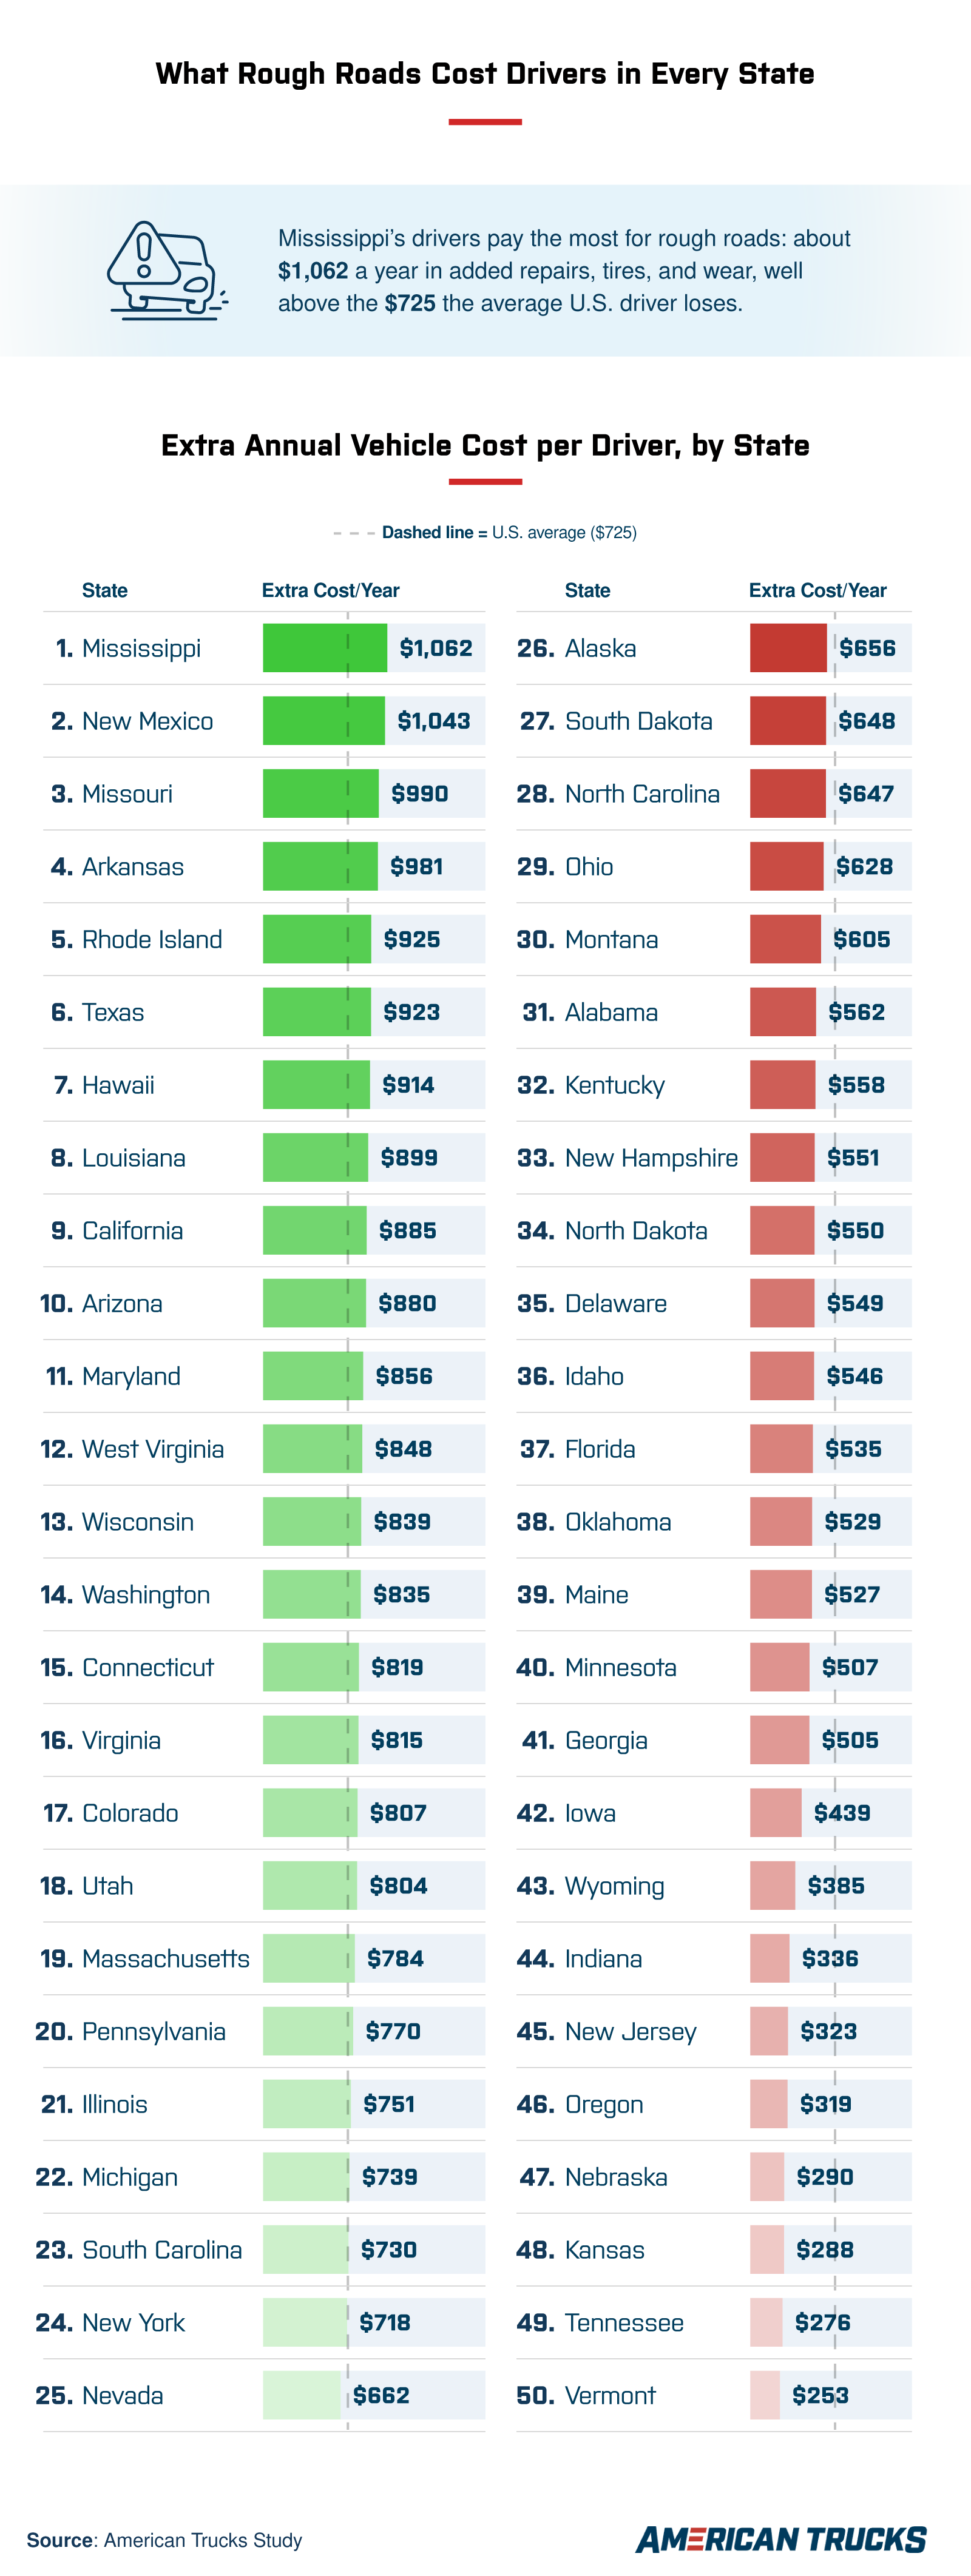
America's roads earned a D+ grade on the American Society of Civil Engineers' 2025 Infrastructure Report Card, highlighting the ongoing challenges posed by aging infrastructure and deferred maintenance. Those conditions translated into real costs for drivers, who lost an average of $725 annually through additional repairs, accelerated tire wear, vehicle depreciation, and increased fuel consumption.
Mississippi drivers faced the highest burden in the nation, paying about $1,062 per year because of rough roads. New Mexico followed closely at $1,043, while Missouri ($990), Arkansas ($981), and Rhode Island ($925) rounded out the top 5 most expensive states. Texas ($923), Hawaii ($914), Louisiana ($899), California ($885), and Arizona ($880) completed the top 10.
The 10 least costly states for drivers were:
- Vermont ($253)
- Tennessee ($276)
- Kansas ($288)
- Nebraska ($290)
- Oregon ($319)
- New Jersey ($323)
- Indiana ($336)
- Wyoming ($385)
- Iowa ($439)
- Georgia ($505)
Drivers in Vermont paid less than one-quarter of what Mississippi drivers lost annually to rough road conditions.
How Bad Is the Pavement in Your State?
Road damage costs don't always tell the entire story. Looking at pavement quality helps explain why some states impose a greater burden on drivers than others.
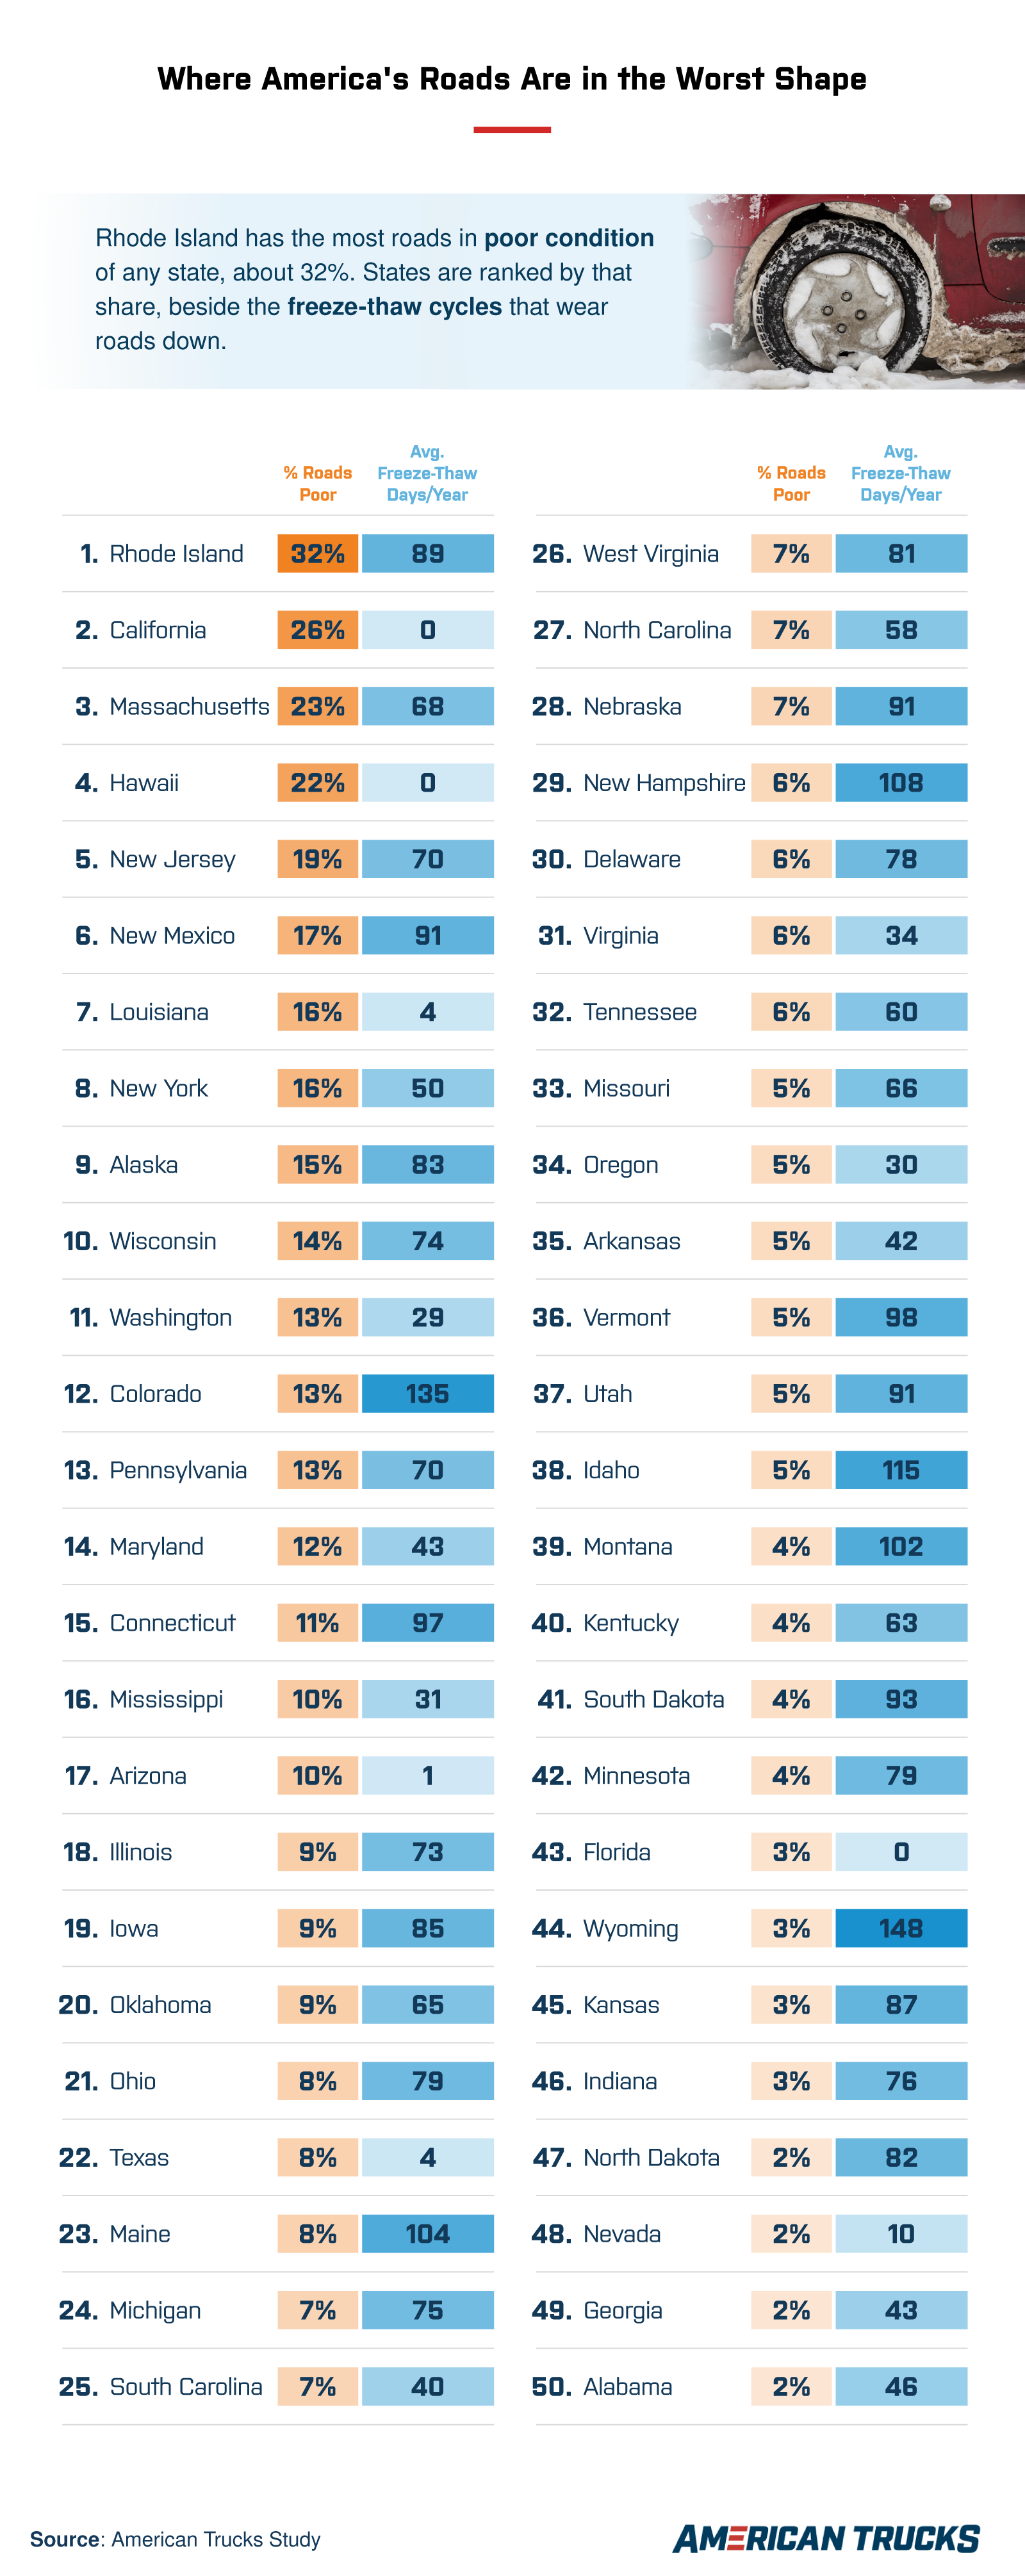
America's worst pavement wasn't concentrated in the coldest parts of the country. Rhode Island led the nation with 32% of roads rated poor, followed by California (26%), Massachusetts (23%), and Hawaii (22%). These figures showed that poor pavement conditions can affect drivers in a wide range of climates and regions.
Climate stress is often blamed for deteriorating roads, but the data suggests a more complicated picture. Wyoming experienced the most freeze-thaw cycles in the country at roughly 148 days per year, yet only 3% of its roads were rated poor. Rhode Island, meanwhile, endured far fewer freeze-thaw cycles but ranked worst in the nation for pavement condition. The findings show that weather alone doesn't determine road quality.
The states with the highest financial burden also challenged common assumptions about road damage. Eight of the 10 most expensive states for drivers (Mississippi, New Mexico, Arkansas, Texas, Hawaii, Louisiana, California, and Arizona) were located in warmer regions rather than the frozen Northeast or Upper Midwest.
The Hidden Cost Beneath Your Tires
Rough roads are more than an inconvenience. They're a recurring expense that affects millions of drivers every year through higher repair bills, faster tire wear, and increased fuel costs, with some drivers paying more than four times as much as others, depending on where they live.
You can't repave your state, but you can put tougher equipment between your truck and the pavement. A set of durable truck wheels and tires built to take a beating goes a long way toward easing what rough roads cost you over the long haul.
Methodology
To build the 2026 Road Damage Index, we ranked all 50 states by the extra vehicle operating cost the average driver pays each year because of rough roads: the added repairs, tire wear, accelerated depreciation, and fuel use that come from driving on deteriorated pavement. Those figures come from TRIP, a national transportation research nonprofit, drawn from its April 2026 state fact sheets.
To show the road conditions behind that cost, we paired each state's pavement quality, the share of roads rated poor in the Federal Highway Administration's 2023 Highway Statistics, with its climate stress, measured as the average number of freeze-thaw days per year. We calculated the freeze-thaw figure from NOAA's 1991–2020 Climate Normals, using two principal metro weather stations per state so the number reflects where most driving occurs.
National context, including the D+ grade for the nation's roads, comes from the American Society of Civil Engineers' 2025 Infrastructure Report Card. All figures reflect the most recent data available as of June 2026.
About American Trucks
American Trucks provides dependable upgrades for drivers who demand more from their trucks. From hauling to off-roading, American Trucks offers truck suspension components that improve ride quality, handling, and load support.
Fair Use Statement
This article's findings may be shared for noncommercial purposes only. If you reference or republish them, please credit American Trucks and link back to this page.