Vehicle theft may be declining nationwide, but it remains a costly reality for hundreds of thousands of drivers each year. Using FBI crime data, NICB theft statistics, HLDI insurance claims data, and U.S. Census population estimates, American Trucks figured out where vehicle theft is most concentrated. We also found which vehicles thieves target most often, and the trends every vehicle owner should know.
Key Takeaways
- U.S. vehicle theft hit a historic low in the past year, with 659,880 vehicles stolen, down 35% from the 2023 peak of 1,020,729.
- A vehicle is stolen every 48 seconds in America.
- 35% of all thefts in the past year came from just 10 metro areas.
- The riskiest city for vehicle theft (Oakland, CA: 1,459 per 100K residents) has a 56x higher rate than the safest comparable large city (Meridian, ID: 26 per 100K).
- The top 3 least risky cities for car theft in the U.S. this past year are Meridian, ID (26 per 100K), Worcester, MA (27 per 100K), and McAllen, TX (30 per 100K)
America's Vehicle Theft Danger Zones
While some communities reported relatively few thefts, others experienced rates hundreds of times higher.
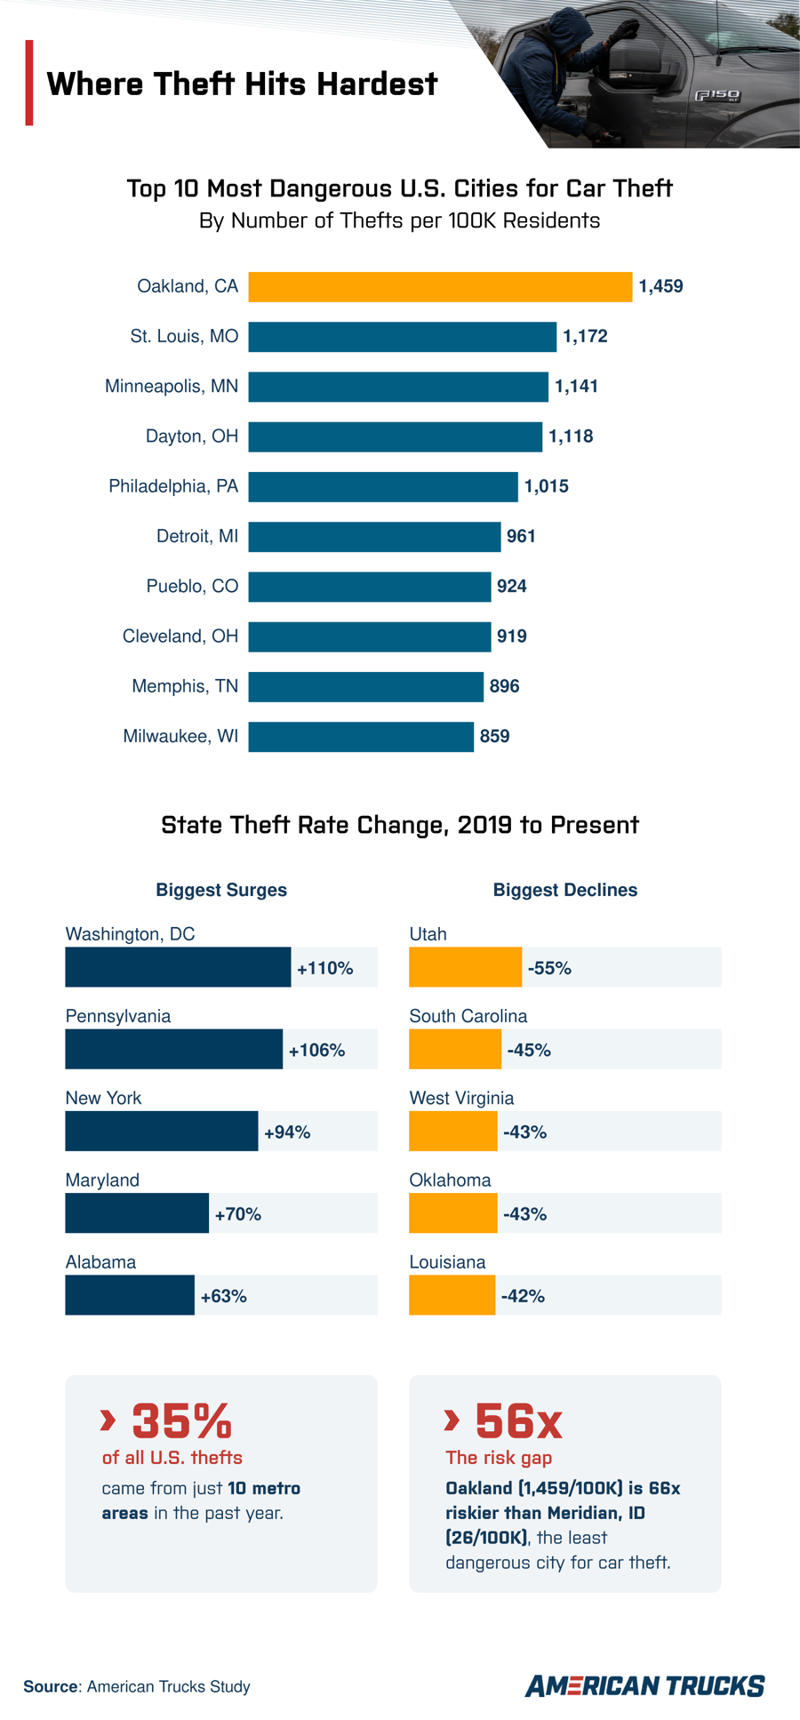
- Highest vehicle theft rates in the past year (per 100,000 residents):
- Oakland, CA: 1,459
- St. Louis, MO: 1,172
- Minneapolis, MN: 1,141
- Dayton, OH: 1,118
- Philadelphia, PA: 1,015
- Detroit, MI: 961
- Pueblo, CO: 924
- Cleveland, OH: 919
- Memphis, TN: 896
- Milwaukee, WI: 859
- The 10 least dangerous U.S. cities for vehicle theft in the past year (per 100,000 residents):
- Meridian, ID: 26
- Worcester, MA: 27
- McAllen, TX: 30
- Allen, TX: 37
- Naperville, IL: 40
- Fishers, IN: 41
- Thousand Oaks, CA: 52
- Frisco, TX: 52
- Irvine, CA: 55
- McKinney, TX: 58
- Oakland's theft rate was more than 56x higher than Meridian's.
Search the full ranking of all 281 U.S. cities below to see how your community compares:
- Where vehicles disappear most often, by how frequently one vehicle is stolen:
-
- Philadelphia, PA: Every 33 minutes
- Oakland, CA: Every 1.4 hours
- Minneapolis, MN: Every 1.8 hours
- St. Louis, MO: Every 2.7 hours
- Dayton, OH: Every 5.7 hours
States Defining America's Vehicle Theft Trends
- The highest vehicle theft rates by state/district (per 100,000 residents):
- Washington, DC: 696
- Nevada: 399
- California: 317
- Maryland: 317
- New Mexico: 312
- The lowest vehicle theft rates by state (per 100,000 residents):
- Vermont: 49
- Idaho: 53
- New Hampshire: 53
- Maine: 59
- West Virginia: 62
- California accounted for 21% of all vehicle thefts nationwide, totaling 136,988 stolen vehicles.
- The fastest-rising vehicle theft rates since 2019:
- Washington, DC: +110%
- Pennsylvania: +106%
- New York: +94%
- Maryland: +70%
- Alabama: +63%
The Vehicles Criminals Want Most
Vehicle type, design, and security technology all affect how attractive a vehicle is to thieves.
Trucks and Muscle Cars Remain Prime Targets
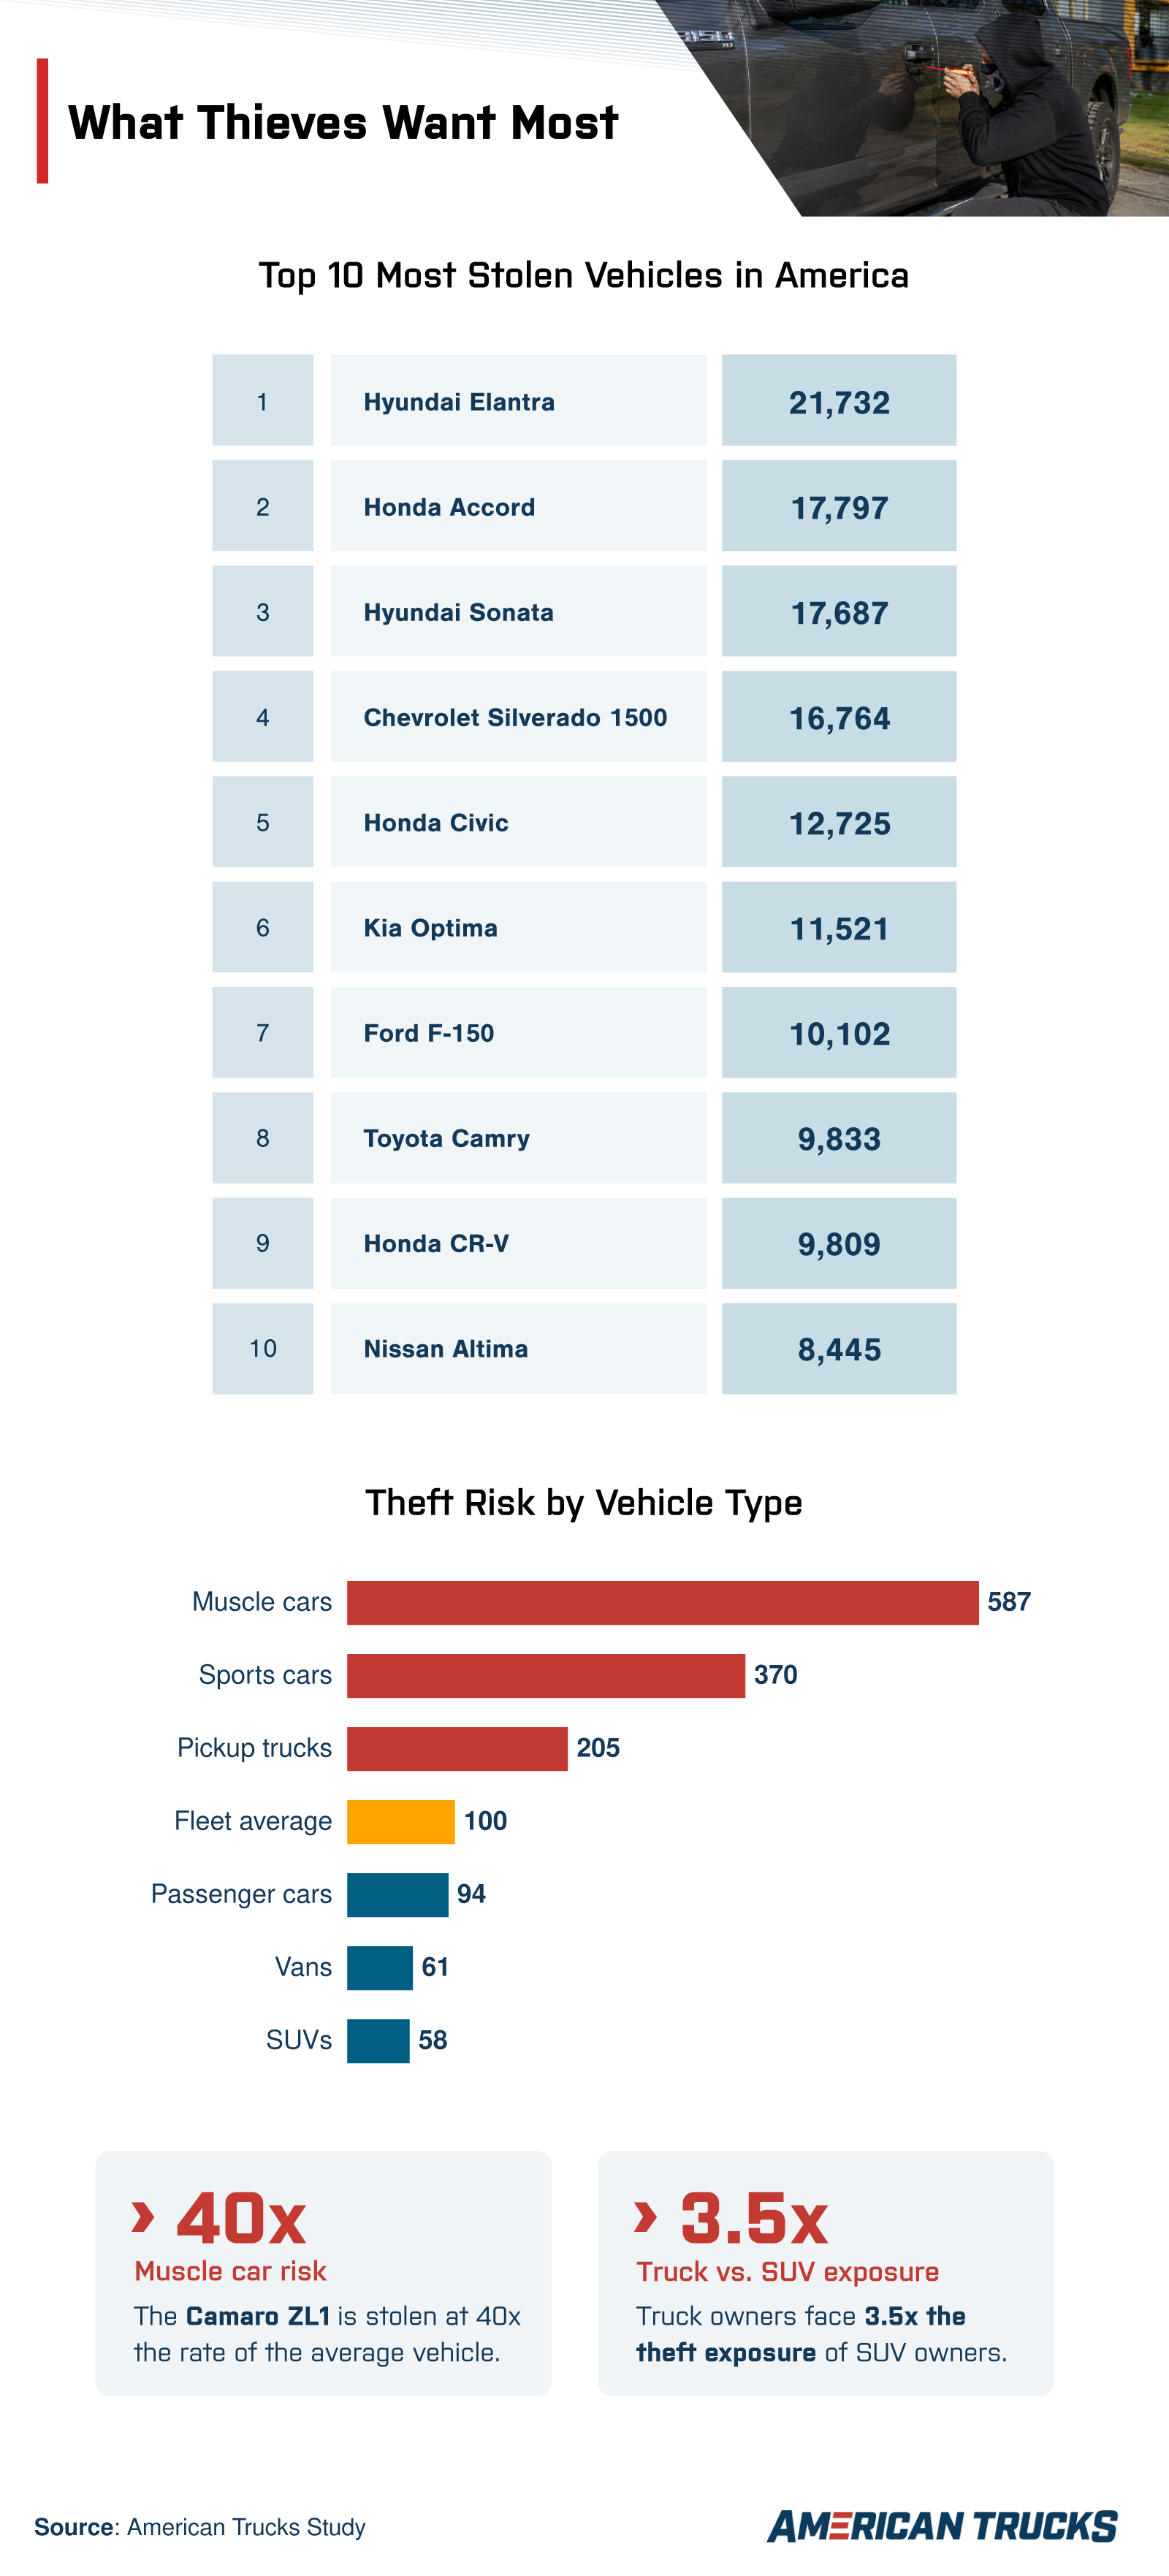
American trucks were the only domestic vehicles to appear among the nation's most-stolen vehicles this year, and the Chevrolet Silverado has been present for the past 3 consecutive years:
- Chevrolet Silverado 1500 ranked No. 4 in 2023 (23,721 thefts), No. 3 in 2024 (21,666), and No. 4 in 2025 (16,764).
- Ford F-150 ranked No. 7 nationally in 2025 with 10,102 thefts.
Based on the HLDI theft index, pickup trucks faced roughly double the average vehicle theft rate, and about 3.5 times the theft exposure of SUV owners:
- Trucks: 205
- Fleet average: 100
- SUVs: 58
Muscle cars experienced some of the highest theft rates on the road:
- Camaro 2-door: 13x the fleet average
- Camaro ZL1: 40x the fleet average
The Security Features That Matter Most
- 6th-generation Camaros (2016+) were stolen at more than 10x the rate of 2010–2015 models, suggesting that push-button ignition removed a key theft barrier.
A gap in anti-theft technology helped fuel the theft surge experienced by certain makes and models:
- Only 26% of 2015 model-year Kia and Hyundai vehicles were equipped with immobilizers.
- By comparison, 96% of vehicles from other manufacturers included immobilizers.
Protecting Your Truck Starts Before a Theft Happens
Vehicle theft remains a serious concern, even as national theft totals continue to move in the right direction. Location, vehicle type, and security technology all influence risk, but owners can help reduce their exposure. Simple upgrades such as steering wheel locks, vehicle tracking systems, and secure parking practices can make a vehicle less attractive to criminals.
As thieves continue adapting their methods, staying informed and taking proactive steps remain among the best ways to keep your vehicle where it belongs, whether that's in your driveway, on the jobsite, or headed toward your next adventure.
Methodology
Motor vehicle theft counts and city-level rankings are drawn from the FBI National Incident-Based Reporting System (NIBRS), with 2025 population denominators from the U.S. Census Bureau Vintage 2025 Estimates (SUB-IP-EST2025-ANNRNK, released May 2026). City rankings include incorporated places with 100,000+ residents. State trend data covers 2019, 2020, and 2022–2025. 2021 is excluded due to a significant drop in agency participation during the FBI's transition from UCR Summary Reporting to NIBRS.
A few important caveats:
- Florida is excluded from state trend comparisons due to known NIBRS participation gaps that artificially suppress reported theft rates.
- Low reported rates in some Texas, Florida, and California cities may be influenced by incomplete NIBRS reporting.
- FBI NIBRS and NICB data come from separate reporting systems (NIBRS vs. NCIC) and should not be combined in the same calculation.
National totals and most-stolen vehicle rankings are sourced from four NICB reports: the 2023 Hot Wheels report (May 2024), the 2024 Vehicle Theft Trends (March 2025), the H1 2025 analysis (September 2025), and the 2025 full-year report (March 2026).
Vehicle segment theft risk data is from the Highway Loss Data Institute (HLDI) Whole-Vehicle Theft report WT-24, covering model years 2022-2024. The HLDI fleet index measures insurance theft claim frequency per 1,000 insured vehicle years, normalized to the average passenger vehicle (index = 100).
Registered vehicle counts by state are from the FHWA Highway Statistics Table MV-1 (2020-2024).
About AmericanTrucks
American Trucks specializes in aftermarket parts and accessories built for hardworking pickups. Truck owners can find truck wheels, tires, and packages from American Trucks that enhance style, durability, and performance on and off the road.
Fair Use Statement
The information and data presented in this article may be shared for noncommercial purposes only. If you reference or republish these findings, please provide proper attribution and include a link back to AmericanTrucks.